×
Energy
Oil
Nuclear
Renewables
Bioenergy
Coal
Environment
Emissions
Sustainability
Carbon Markets
Technology
Energy Storage and Batteries
Carbon Capture
Transportation
Infrastructure
Materials
Space
Electricity
Hydrogen
Mining and Minerals
News
Infographics
Energy
Oil
Natural Gas
Nuclear
Renewables
Bioenergy
Coal
Environment
Emissions
Sustainability
Carbon Markets
Technology
Energy Storage and Batteries
Carbon Capture
Transportation
Infrastructure
Materials
Space
Electricity
Hydrogen
Mining and Minerals
Search
Susbcribe
Susbcribe
Home »
Infographics
Infographics
Energy
Bioenergy
Coal
Nuclear
Oil
Natural Gas
Renewables
Environment
Carbon Markets
Emissions
Sustainability
Technology
Carbon Capture
Electricity
Energy Storage and Batteries
Hydrogen
Infrastructure
Materials
Mining and Minerals
Space
Transportation
Category Menu
Energy
Bioenergy
Coal
Nuclear
Oil
Natural Gas
Renewables
Environment
Carbon Markets
Emissions
Sustainability
Technology
Carbon Capture
Electricity
Energy Storage and Batteries
Hydrogen
Infrastructure
Materials
Mining and Minerals
Space
Transportation
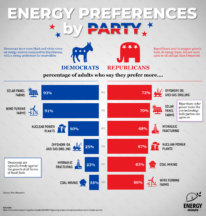
Views on Energy Sources by Party
Aaron Foyer
January 26, 2024
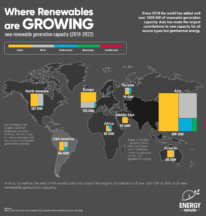
5-year Growth in Global Renewables
Cody Good
December 1, 2023
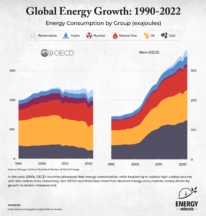
Global Energy Growth: OECD v. Developing Nations
Aaron Foyer
September 29, 2023
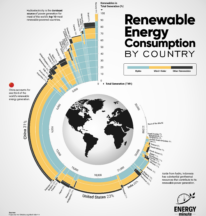
Renewable Energy Consumption by Country
Cody Good
September 22, 2023
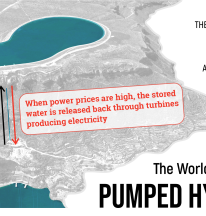
The World’s Largest Batteries: Pumped Hydro
Aaron Foyer
May 11, 2023
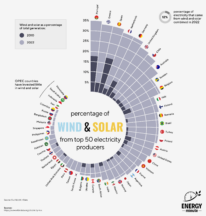
Percentage of Wind and Solar by Country
Aaron Foyer
May 5, 2023
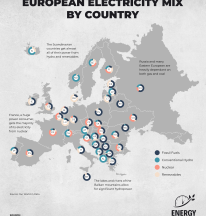
European Electricity Mix by Country
Aaron Foyer
March 24, 2023
How Canada and the U.S. Reduced Their Electricity Emissions
Aaron Foyer
February 24, 2023
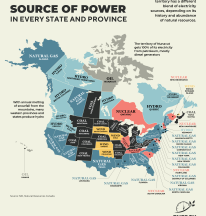
The Biggest Source of Power in Every State and Province
Aaron Foyer
November 25, 2022
The Supply Risk of Key Transition Metals and Minerals
Aaron Foyer
August 19, 2022
Posts navigation
1
2
3
Next
Search for: